Spreadsheet Woes – Burden in SOX Compliance and Other Regulations

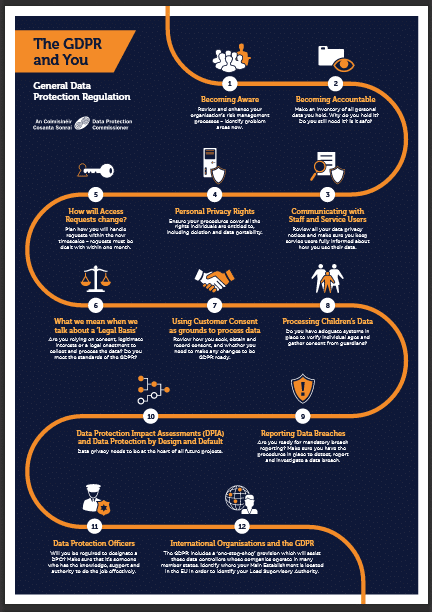
End User Computing (EUC) or end User Developed Application (UDA) systems like spreadsheets used to be ideal ad-hoc solutions for data processing and financial reporting. But those days are long gone.

Today, due to regulations like the:

  • Sarbanes-Oxley (SOX) Act,
  • Dodd-Frank Act,
  • IFRS (International Financial Reporting Standards),
  • E.U. Data Protection Directive,
  • Basel II,
  • NAIC Model Audit Rules,
  • FAS 157,
  • yes, there?s more ? and counting

a company can be bogged down when it tries to comply with such regulations while maintaining spreadsheet-reliant financial and information systems.

In an age where regulatory compliance have become part of the norm, companies need to enforce more stringent control measures like version control, access control, testing, reconciliation, and many others, in order to pass audits and to ensure that their spreadsheets are giving them only accurate and reliable information.

Now, the problem is, these control measures aren’t exactly tailor-made for a spreadsheet environment. While yes, it is possible to set up a spreadsheet and EUC control environment that utilises best practices, this is a potentially expensive, laborious, and time-consuming exercise, and even then, the system will still not be as foolproof or efficient as the regulations call for.

Testing and reconciliation alone can cost a significant amount of time and money to be effective:

  1. It requires multiple testers who need to test spreadsheets down to the cell level.
  2. Testers will have to deal with terribly disorganized and complicated spreadsheet systems that typically involve single cells being fed information by other cells in other sheets, which in turn may be found in other workbooks, or in another folder.
  3. Each month, an organisation may have new spreadsheets with new links, new macros, new formulas, new locations, and hence new objects to test.
  4. Spreadsheets rarely come with any kind of supporting documentation and version control, further hampering the verification process.
  5. Because Windows won’t allow you to open two Excel files with the same name simultaneously and because a succession of monthly-revised spreadsheets separated by mere folders but still bearing the same name is common in spreadsheet systems, it would be difficult to compare one spreadsheet with any of its older versions.

But testing and reconciliation are just two of the many activities that make regulatory compliance terribly tedious for a spreadsheet-reliant organisation. Therefore, the sheer intricacy of spreadsheet systems make examining and maintaining them next to impossible.

On the other hand, you can’t afford not to take these regulations seriously. Non-compliance with regulatory mandates can have dire consequences, not the least of which is the loss of investor confidence. And when investors start to doubt the management’s capability, customers will start to walk away too. Now that is a loss your competitors will only be too happy to gain.

Learn more about our server application solutions and discover a better way to comply with regulations.

More Spreadsheet Blogs


Spreadsheet Risks in Banks


Top 10 Disadvantages of Spreadsheets


Disadvantages of Spreadsheets – obstacles to compliance in the Healthcare Industry


How Internal Auditors can win the War against Spreadsheet Fraud


Spreadsheet Reporting – No Room in your company in an age of Business Intelligence


Still looking for a Way to Consolidate Excel Spreadsheets?


Disadvantages of Spreadsheets


Spreadsheet woes – ill equipped for an Agile Business Environment


Spreadsheet Fraud


Spreadsheet Woes – Limited features for easy adoption of a control framework


Spreadsheet woes – Burden in SOX Compliance and other Regulations


Spreadsheet Risk Issues


Server Application Solutions – Don’t let Spreadsheets hold your Business back


Why Spreadsheets can send the pillars of Solvency II crashing down

?

Advert-Book-UK

amazon.co.uk

?

Advert-Book-USA

amazon.com

Contact Us

  • (+353)(0)1-443-3807 – IRL
  • (+44)(0)20-7193-9751 – UK

Check our similar posts

What is Business Intelligence?

How well do you know your customers? That is, can you actually pinpoint which among them are you most profitable with and which are making you spend more? Are you content with the accuracy of your forecasts and market predictions? Do you feel you’re spending more on legal costs and regulatory compliance than you should?

Your IT department may be handling these concerns pretty well but perhaps you’d like to know how you can further improve things.

What we’ve got is an IT solution wrapped in a fancy name called ‘Business Intelligence’ or BI. If you think that’s too strong a term, we invite you to read more below, then you be the judge.

Dashboards – Determine the health of your business at a glance

Most drivers rarely make use of their car’s dashboard. After all, you can still reach your destination by just using the steering wheel, pedals, gear stick and so on. But that’s not exactly the most efficient way to drive, right?

If you want to save on fuel, you’ll want to glance on the RPM and speedometer from time to time. You might also want to utilise the trip meter to determine which route is the shortest to a given destination. Other dashboard components like the fuel gauge, tire pressure gauge, engine temperature indicator, and volt meter can likewise provide information about your car’s health.

The same concept applies to business management. If you want to run your business intelligently, you can make use of BI dashboards. These are tools in a typical business intelligence package that will allow you to determine the health of your business via a set of smartly configured gauges and other intuitive graphical representations.

So that, literally, at a mere glance, you’ll already know whether various units in your company are working efficiently. A dashboard will also give you instant feedback of the strategies you’ve recently implemented; to let you know if things are working as planned.

If you want more information than a dashboard can provide, our BI packages also include highly customised reports.

Reports that help you decide faster

Dashboards are great for getting valuable information at a glance but they won’t tell you everything. For more details, you’ll need to view highly customised reports. Our reports are tailor made for each user. We see to it that, by default, each person gets the information he needs the most.

If you belong to the sales department, you normally won’t need a presentation of the data that is appropriate for people in accounting. That way, you don’t spend time filtering. Instead, you and your people can move on to making well-informed decisions.

Our BI systems make use of your vast collection of data to provide reports that will organise your regulatory requirements and call your attention to approaching deadlines. The same system will provide the right information for your people on the field. If your team members are equipped with smart phones and Pocket PCs, they can retrieve whatever it is they need to know to close deals, make sales, and serve clients faster than the competition.

Generating logical information from disparate sources of data scattered over an enterprise-wide organisation is no easy task. But we’ll make it look simple. That’s because we’ve got the expertise to bring it all together into a robust data warehouse and to extract them in the form of reports and dashboards through OLAP.

OLAP and Data Warehousing – Powering the generation of actionable information

Want to know how to generate reports with the highest degree of accuracy and reliability? In theory, what you need is a single repository or a data warehouse. That is, order receipts, sales invoices, as well as customer & supplier data is integrated with regulatory details, personnel data, and others. These are all specially organised for future reporting and analysis.

However, data, no matter how all-embracing, is useless until it is processed into actionable information. Through OLAP or Online Analytical Processing, you can seamlessly collect all relevant data from your vast repository to answer queries like “What is our company’s profitability for the 2nd quarter in all identified key cities for our top-of-the-line products?”.

The strength of OLAP lies in its inherent ability to perform data analysis and very complex calculations, thus enabling it to return complex queries much faster than other database technologies. It is therefore suitable for very large data sources, i.e., data warehouses.

Dashboards and reports will only give your organisation the edge if the information retrieved is reliable, fast, and accurate – exactly the kind OLAP is so good at.

Mobile BI – Step back and see the big picture anytime, anywhere

Spreadsheets are great for displaying detailed information. However, in today’s highly competitive market, retrieving information that matters the most in the shortest possible time is vital in maintaining a sizeable lead over the competition. To step back and see the big picture, you’ll need insightful tools like dashboards and automatically generated reports.

Reports can be beamed to mobile devices such as smart phones and Pocket PCs. They can also be viewed on eBook readers as well. You can also do the same tasks with spreadsheets. But imagine how you’d need to scroll over a large spreadsheet on any of these mobile devices just to know which customer in your current location has performed well over the last month.

If you really want to make quick, well-informed decisions, BI dashboards for mobile devices is the way to go. You can make use of various business objects such as drill-able charts, performance metrics, and metric trend graphs to make crucial decisions even when on you’re in the field.

Uncover hidden opportunities with energy data analytics

What springs to mind when you hear the words energy data analytics? To me, I feel like energy data analytics is not my thing. Energy data analytics, however, is of great importance to any organisation or business that wants to run more efficiently, reduce costs, and increase productivity. Energy efficiency is one of the best ways to accomplish these goals.

Energy efficiency is not about investment in expensive equipment and internal reorganization. Enormous energy saving opportunities is hidden in already existing energy data. Given that nowadays, energy data can be recorded from almost any device, a lot of data is captured regularly and therefore a lot of data is readily available.

Organisations can use this data to convert their buildings’ operations from being a cost centre to a revenue centre through reduction of energy-related spending which has a significant impact on the profitability of many businesses. All this is possible through analysis and interpretation of data to predict future events with greater accuracy. Energy data analytics therefore is about using very detailed data for further analysis, and is as a consequence, a crucial aspect of any data-driven energy management plan.

The application of Data and IT could drive significant cost savings in company-owned buildings and vehicle fleets. Virtual energy audits can be performed by combining energy meter data with other basic data about a building e.g. location, to analyse and identify potential energy savings opportunities. Investment in energy dashboards can further enable companies to have an ongoing look at where energy is being consumed in their buildings, and thus predict ways to reduce usage, not to mention that energy data analytics unlock savings opportunities and help companies to understand their everyday practices and operating requirements in a much more comprehensive manner.

Using energy data analytics can enable an organisation to: determine discrepancies between baseline and actual energy data; benchmark and compare previous performance with actual energy usage. Energy data analytics also help businesses and organisations determine whether or not their Building Management System (BMS) is operating efficiently and hitting the targeted energy usage goals. They can then use this data to investigate areas for improvement or energy efficient upgrades. When energy data analytics are closely monitored, companies tend to operate more efficiently and with better control over relevant BMS data.

Becoming Nimble the Agile Project Management Way

In dictionary terms, ?agile? means ?able to move quickly and easily?. In project management terms, the definition is ?project management characterized by division of tasks into short work phases called ?sprints?, with frequent reassessments and adaptation of plans?. This technique is popular in software development but is also useful when rolling out other projects.

Managing the Seven Agile Development Phases

  • Stage 1: Vision. Define the software product in terms of how it will support the company vision and strategy, and what value it will provide the user. Customer satisfaction is of paramount value including accommodating user requirement changes.
  • Stage 2: Product Roadmap. Appoint a product owner responsible for liaising with the customer, business stakeholders and the development team. Task the owner with writing a high-level product description, creating a loose time frame and estimating effort for each phase.
  • Stage 3: Release Plan. Agile always looks ahead towards the benefits that will flow. Once agreed, the Product Road-map becomes the target deadline for delivery. With Vision, Road Map and Release Plan in place the next stage is to divide the project into manageable chunks, which may be parallel or serial.
  • Stage 4: Sprint Plans. Manage each of these phases as individual ?sprints?, with emphasis on speed and meeting targets. Before the development team starts working, make sure it agrees a common goal, identifies requirements and lists the tasks it will perform.
  • Stage 5: Daily Meetings. Meet with the development team each morning for a 15-minute review. Discuss what happened yesterday, identify and celebrate progress, and find a way to resolve or work around roadblocks. The goal is to get to alpha phase quickly. Nice-to-haves can be part of subsequent upgrades.
  • Stage 6: Sprint Review. When the phase of the project is complete, facilitate a sprint review with the team to confirm this. Invite the customer, business stakeholders and development team to a presentation where you demonstrate the project/ project phase that is implemented.
  • Stage 7: Sprint Retrospective. Call the team together again (the next day if possible) for a project review to discuss lessons learned. Focus on achievements and how to do even better next time. Document and implement process changes.

The Seven Agile Development Phases ? Conclusions and Thoughts

The Agile method is an excellent way of motivating project teams, achieving goals and building result-based communities. It is however, not a static system. The product owner must conduct regular, separate reviews with the customer too.

Ready to work with Denizon?